
Canvas editor
Build and edit hand-placed YAML diagrams with the mouse, and keep the YAML file as the source of truth.
The canvas editor in spinagram serve lets you build a diagram with the mouse. You can drop icons and provider
zones from a palette, draw boxes and arrows with the toolbar, group nodes into rows and columns, and edit any element's
properties in a side panel. The YAML file stays the source of truth. Every edit is a minimal patch: comments, key
order and the entries you did not touch stay as they were.
Quick start
pip install 'spinagram[ui]'
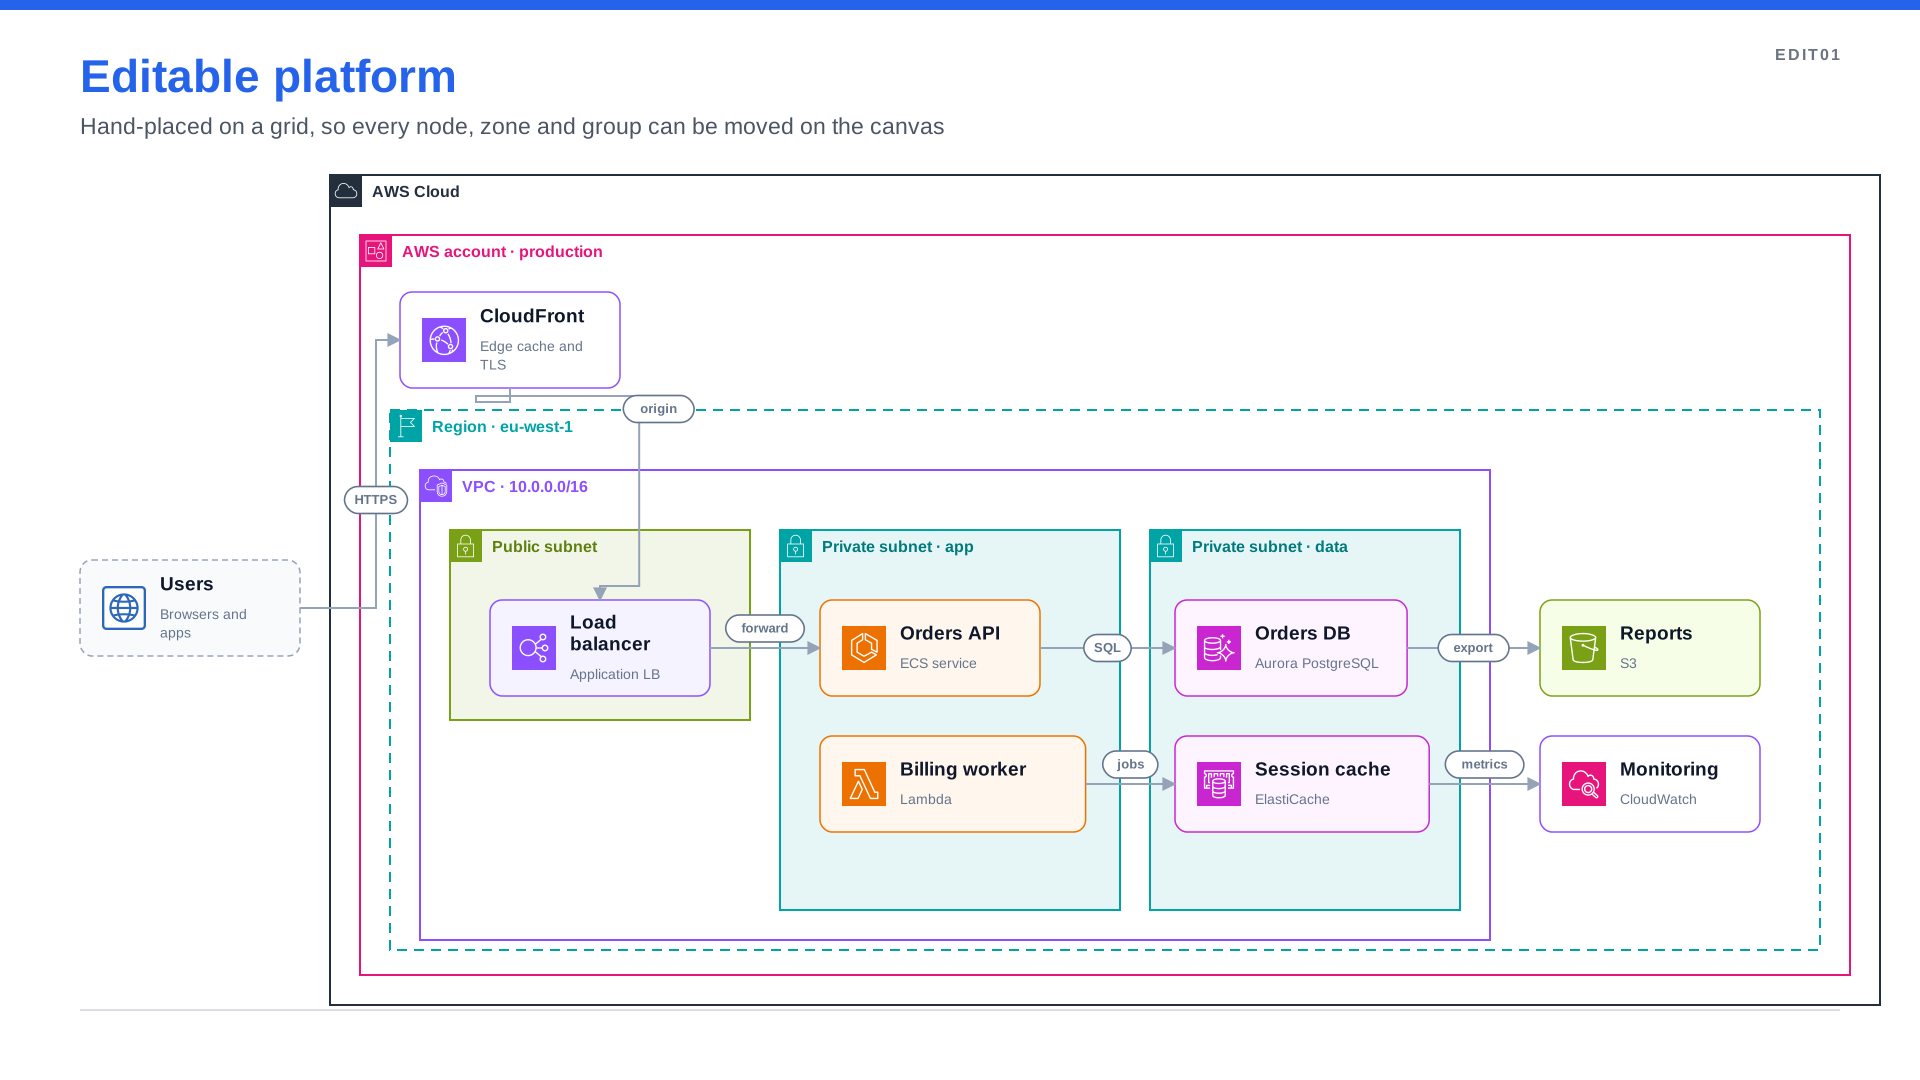
spinagram serve examples/showcase/ # opens http://127.0.0.1:8765- Open Editable platform (
examples/showcase/editable_platform.yaml). - Press Canvas, or
c. - Drag a box. The arrows follow while you drag, and on release the YAML gets the new coordinates.
- Press
/and typevpc. Drag VPC onto the canvas to add an AWS VPC zone. - Click a node to open the Elements panel, change its title, and press Enter.
- Press
?for every shortcut, and Ctrl/Cmd+Z to undo.
What the canvas can edit
The canvas edits a hand-placed YAML spec:
- one diagram per file;
- coordinates on its items (
x/yorat:); - no
layout:engine; - rows and columns are allowed.
Python specs, engine layouts and snakes keep the read-only view, and the page says so. Edit those in the code
panel, or freeze an automatic layout to YAML with spinagram layout and edit that copy.
Edits go through the same version-checked save as the code panel. If the file changes on disk while you edit, the edit is dropped with "File changed on disk; edit not applied" and the undo history is cleared.
Toolbar
The toolbar sits on the left edge of the canvas. Hover a button for its name and key. The dock button at its end moves the toolbar to the bottom of the canvas, above the zoom controls, and back. Your browser remembers the choice.
| Tool | Key | What it does |
|---|---|---|
| Select | V | The default. Click to select, drag to move, drag on empty canvas to draw a selection box |
| Pan | H | Drag to move the view. Holding Space pans in any tool, and Alt+drag pans in Select |
| Box, Text, Zone | B, T, Z | A click places the default size centred on the point. A drag draws the rectangle, snapped to the 10 px grid. Text opens its title editor at once |
| Connect | C | Drag from one node to another to add an edge. Releasing on empty canvas, the same node or a zone adds nothing |
| Group, Ungroup | Ctrl/Cmd+G | Groups the selected nodes into a row (gap 20), or ungroups a row or column |
| Delete, Undo, Redo | Delete, Ctrl/Cmd+Z, Shift+Ctrl/Cmd+Z | Undo and redo cover the last 50 canvas edits of the page |
Palette, Elements, ? | /, ? | Open the palette, the element panel, or the shortcut sheet |
A tool returns to Select after one use. Hold Shift to keep it.
Select, move and group
| Do this | Result |
|---|---|
| Click a node, a zone header, or a row or column | Selects it. With the code panel open, its YAML entry is highlighted |
| Shift+click, or drag on empty canvas | Adds to the selection, or draws a selection box |
| Drag | Moves the selection, snapped to the 10 px grid. Edges follow while you drag |
| Drag onto a zone, or out of one | Puts the node or zone in the innermost zone under its centre, or takes it out. The target zone is highlighted while you drag |
| Drag a zone by its header | Moves the zone and everything inside it |
| Drop a node on a row or column, or drag a member out | Inserts it at the gap its centre falls in, or removes it. A row left with one member dissolves |
| Select a row or column | Ungroup, plus its Gap (and Align, for containers inside a zone) |
| Double-click | Renames a node or a zone label, or edits an edge label |
| Arrow keys, Shift+arrow | Nudges the selection 1 px, or 10 px. Keys pressed in one burst are one save and one undo step |
| Esc | Cancels a drag, then clears the selection, then returns to Select, then closes the palette |
A zone cannot be dropped inside itself. The reason appears next to the pointer for three seconds, and the file is not changed.
Arrows
Click an edge, on its line or its label, to select it. It is highlighted, with a handle at each end.
- Delete removes it.
- Double-click edits its label.
- Drag an end handle onto another node to reconnect that end. Releasing on empty canvas, a zone, or the edge's own other end changes nothing.
- Shift+click adds more edges to the selection.
- To add a new edge, use the Connect tool, or Add connection on a selected node.
Palette
Press / or Ctrl/Cmd+K, or the palette button of the toolbar. The palette opens next to the diagram, and the search
box takes the keyboard.
- ↑ and ↓ move through the results.
- Enter adds the selected item at the centre of the canvas.
- Dragging an item onto the canvas adds it at the drop point.
- Esc closes the palette.
With the search box empty, the palette shows collapsible categories, each with a count and an icon on every item:
- Basics: Box, Text, Zone, Row, Column, Note.
- Zones: the generic zone, then the provider zone styles of AWS, Azure, Google Cloud and Kubernetes. Each has its real header icon and a swatch of its outline.
- Shapes: every other node shape (pill, diamond, process, document and so on).
- One category per icon pack you have downloaded.
- Not downloaded: registered packs with a Fetch button. Nothing is fetched until you press it.
A search gives one ranked list, with each row tagged by its category. It matches names, aliases and pack names, and
tolerates one typo, so "postgress" finds postgres. A dropped icon becomes a node 220 × 96 with
icon: pack:name. A dropped provider zone gets that style, written as color: aws-vpc in the YAML.
Elements and properties
Selecting an element opens the Elements panel on the right. You can also open it from the toolbar. Its pin keeps it open or closed as you left it, and your browser remembers that.
The tree shows:
- zones nested by what they hold;
- rows and columns with their members;
- free nodes;
- an Edges group listing
from → to (label).
Each row has its icon. Clicking a row selects the element on the canvas, and selecting on the canvas reveals its row. The filter box narrows the tree, keeping the parents of each match.
The properties of the selection sit under the tree:
| Element | Fields |
|---|---|
| Node | title, text, icon (Change… opens a search over the downloaded packs), kind, class, position and size |
| Zone | label, style (the provider zone styles), class, position and size |
| Edge | from and to (node lists), label, route, dashed, color, class and arrow ends |
Press Enter or leave a field to apply it; a select or checkbox applies at once. Each change is one save and one undo step. Only the keys the YAML loader accepts are written, and a refused value shows as a message at the pointer. With several elements selected, the panel shows the fields they share and changes all of them in one step.
Quick actions sit above the fields:
- Duplicate: a copy offset by 30 px, in the same zone and row or column.
- Add connection: starts the Connect tool from that node.
- Group as row or column, and Ungroup.
- Move to zone: a list of zones, or the top level.
- Change style, for a zone.
- For an edge: Reverse, Add a parallel edge and Delete.
How the YAML changes
The canvas never rewrites the file. Each edit replaces only the bytes it changes.
nodes:
  # the API tier
  - {id: api, title: Orders API, at: [820, 590, 220, 96], icon: "aws:ecs"}
Drag the box 40 px right and rename it, and only the two values change:
nodes:
  # the API tier
  - {id: api, title: Orders service, at: [860, 590, 220, 96], icon: "aws:ecs"}
Writing style:
- New entries follow the style of their list: one-line
{...}entries when the list uses them, block entries otherwise. - New edges use the short form
"a -> b". Setting a property other than the label turns that edge into a{from, to, ...}mapping. - Titles and labels are plain YAML text unless they need quotes: a colon and space, a leading symbol,
yes/no/null, a number, or a comma inside a one-line entry.
Under the hood
The canvas uses the same Rust engine as the CLI, compiled to WebAssembly and run in a Web Worker:
- While you drag, the browser re-routes the edges of the moved items with the engine's own router and draws them with its own SVG writer, so the preview matches the final picture.
- On release, the engine's edit operations patch the YAML. The server saves the file and renders the diagram,
and the page patches the new SVG into place. Every drawn item carries a
data-id, so icons and fonts are never reloaded.
The same edit operations are available from Python as spinagram.edit, for scripts and
AI agents.