
Several diagram types on one slide
Put a flowchart, a state machine or a swimlane process next to your architecture.
Real explanations mix kinds of diagram: here is the system, here is what it decides, here is the life of the thing it manages. In spinagram any diagram can hold typed regions:
Inside any Diagram | You get the verbs of |
|---|---|
with d.flowchart("Title") as fc: | Flowchart: start, process, decision with .yes() / .no(), io, end |
with d.state_machine("Title") as sm: | StateMachine: state, initial, final, s.on(event, target) |
with d.activity("Title") as act: | Activity: lane, sequence, parallel, action, send |
Each region is laid out by its own engine (the layered one by default) and sits in the page like any box. Connect
across regions with the usual a.to(b, "label").
Architecture, flowchart and state machine
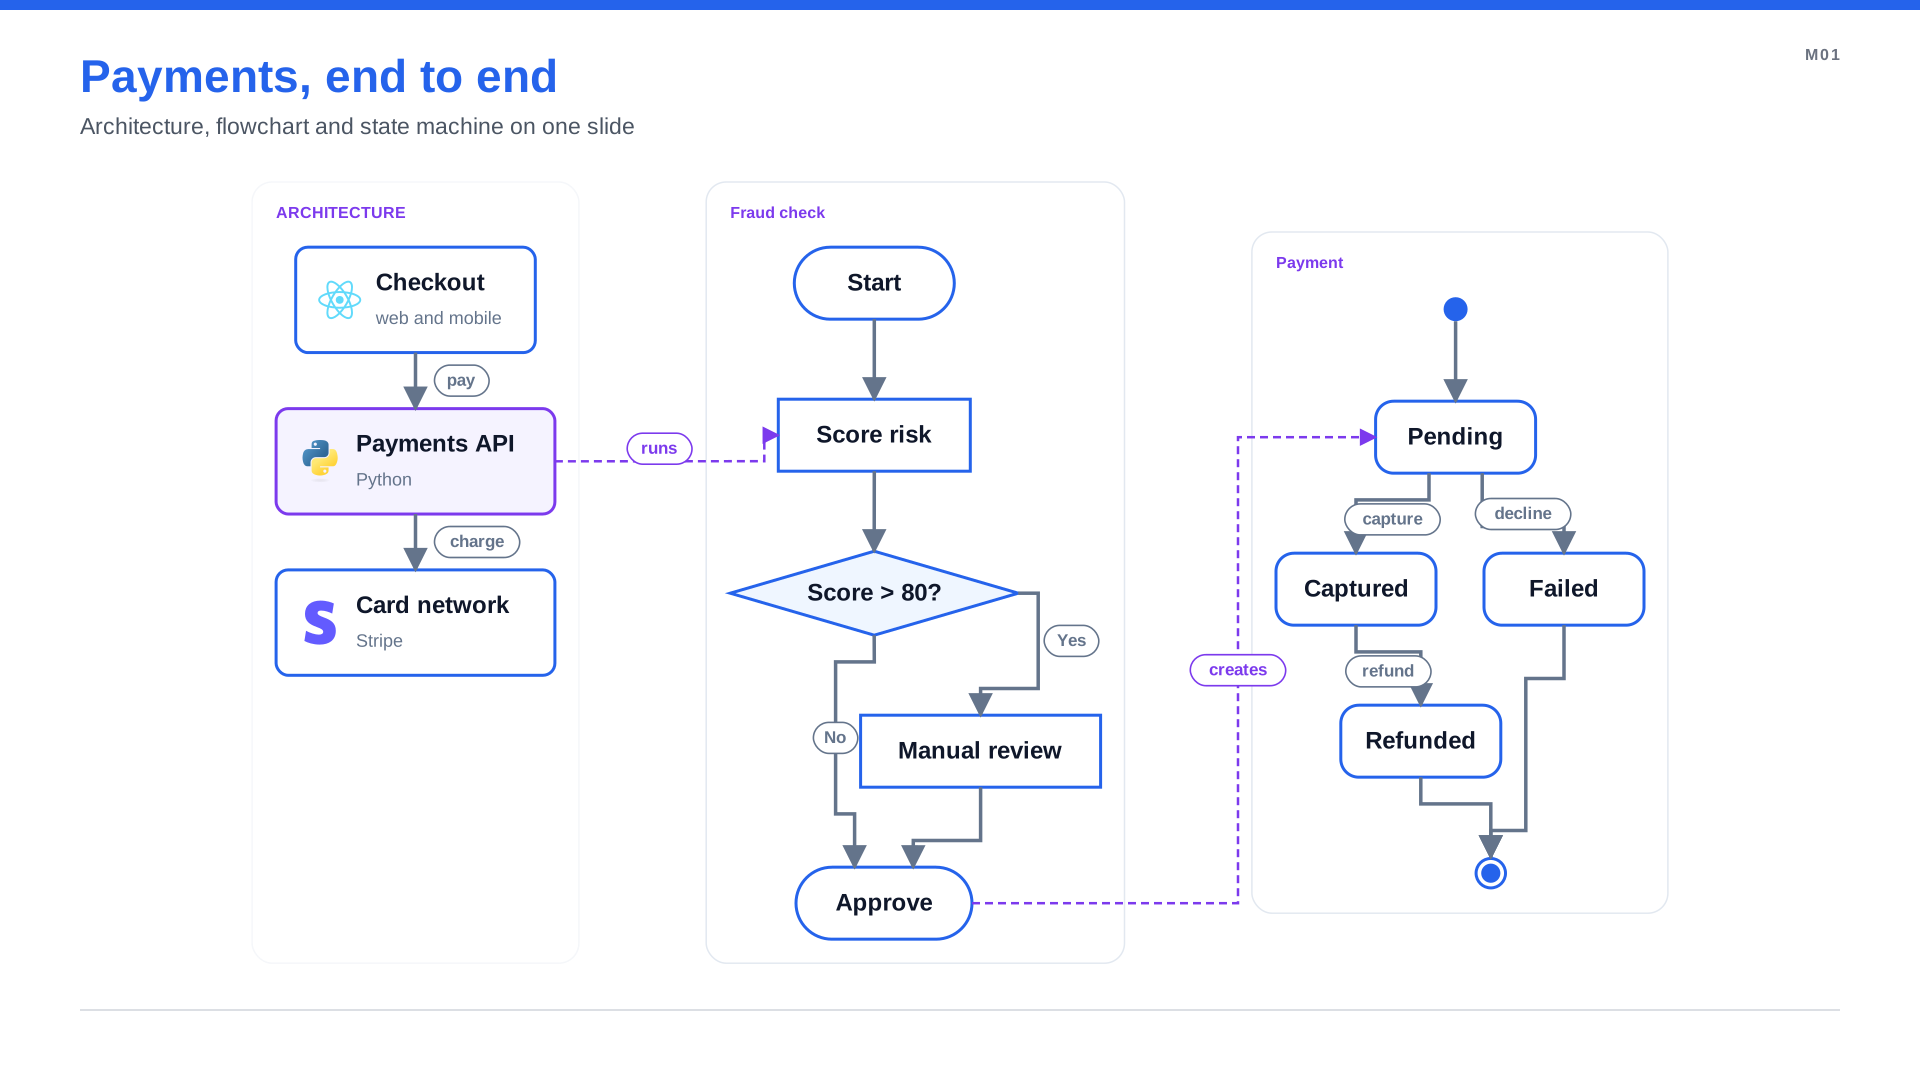
The payments API runs a fraud check; an approved check creates a payment, whose lifecycle is a state machine.
"""Three diagram types on one slide: the payments architecture, the fraud-check flowchart its API runs
and the lifecycle of a payment. Each region has its own layout; arrows connect them like any boxes."""
from spinagram import Diagram

d = Diagram("M01", "Payments, end to end", subtitle="Architecture, flowchart and state machine on one slide",
            layout={"engine": "flex", "direction": "right", "gap": 56})
d.stylesheet("mixed.css")

with d.flowchart("Fraud check", id="fraud", class_="flow") as fc:
    start = fc.start()
    score = fc.process("Score risk")
    risky = fc.decision("Score > 80?")
    review = fc.process("Manual review")
    ok = fc.end("Approve")
    start >> score >> risky
    risky.yes(review) >> ok
    risky.no(ok)

with d.group("Architecture", id="arch", class_="arch", direction="down"):
    shop = d.box("Checkout", text="web and mobile", icon="terrastruct:react")
    api = d.box("Payments API", text="Python", icon="terrastruct:python", class_="hero")
    psp = d.box("Card network", text="Stripe", icon="selfhosted:stripe")
shop.to(api, "pay")
api.to(psp, "charge")

with d.state_machine("Payment", id="payment", class_="states") as sm:
    pending = sm.state("Pending")
    captured = sm.state("Captured")
    refunded = sm.state("Refunded")
    failed = sm.state("Failed")
    sm.initial >> pending
    pending.on("capture", captured)
    pending.on("decline", failed)
    captured.on("refund", refunded)
    refunded >> sm.final
    failed >> sm.final

api.to(score, "runs", class_="link")
ok.to(pending, "creates", class_="link")
Architecture and swimlanes
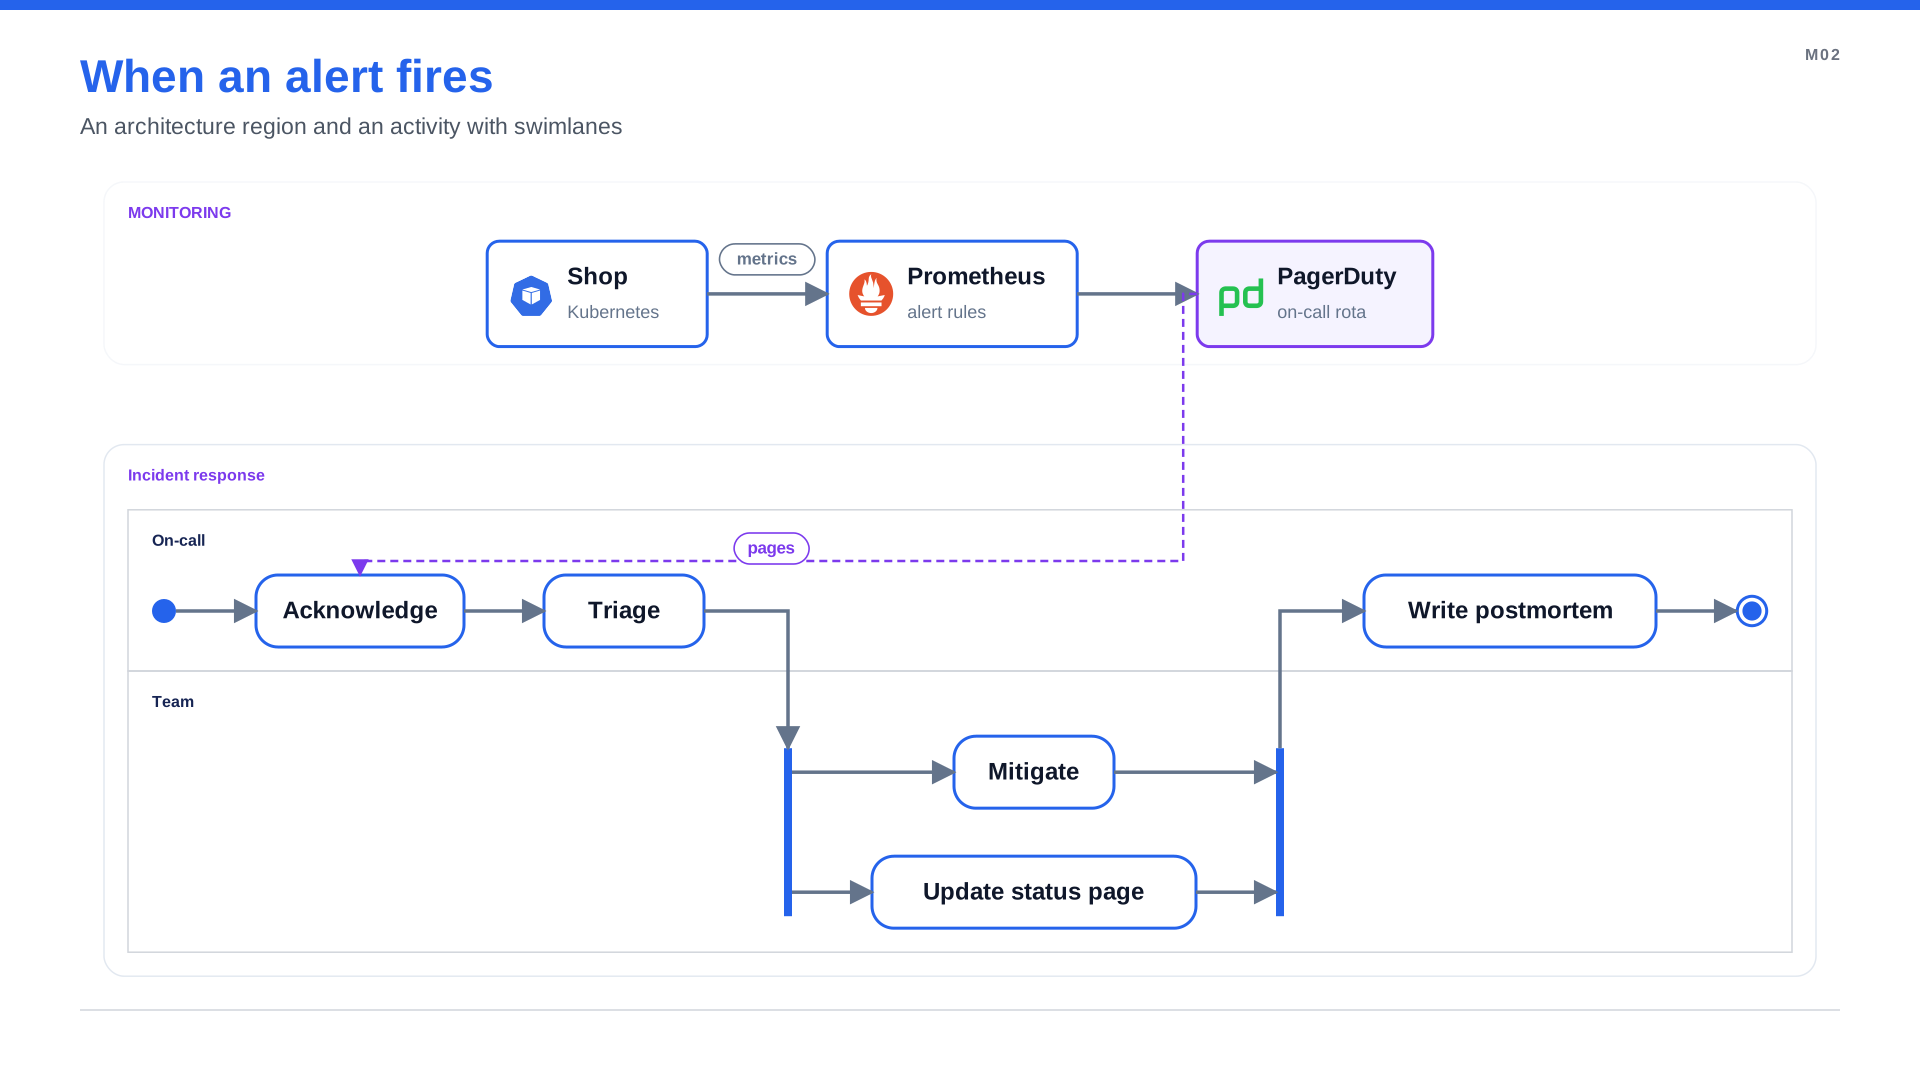
The monitoring stack raises the alert; the activity shows what the on-call engineer and the team do next, with mitigation and the status page update in parallel.
"""Architecture and process on one slide: the monitoring stack that raises an alert, and the swimlane
activity the on-call team follows when it fires."""
from spinagram import Diagram

d = Diagram("M02", "When an alert fires", subtitle="An architecture region and an activity with swimlanes",
            layout={"engine": "flex", "direction": "down", "gap": 28})
d.stylesheet("mixed.css")

with d.group("Monitoring", id="stack", class_="arch", direction="right", gap=120, padding=18):
    app = d.box("Shop", text="Kubernetes", icon="k8s:pod")
    prom = d.box("Prometheus", text="alert rules", icon="selfhosted:prometheus")
    pager = d.box("PagerDuty", text="on-call rota", icon="selfhosted:pagerduty", class_="hero")
app.to(prom, "metrics") >> pager

with d.activity("Incident response", id="response", class_="flow", direction="right") as act:
    with act.sequence():
        with act.lane("On-call"):
            act.start()
            ack = act.action("Acknowledge")
            act.action("Triage")
        with act.lane("Team"):
            with act.parallel() as par:
                with par.branch():
                    act.action("Mitigate")
                with par.branch():
                    act.action("Update status page")
        with act.lane("On-call"):
            act.action("Write postmortem")
            act.end()

pager.to(ack, "pages", class_="link")
/* Shared look for mixed slides: each region reads as its own card. */
:root { --ink: #0F172A; --mute: #64748B; --accent: #7C3AED; }

group.arch, group.flow, group.states { fill: #FFFFFF; fill-opacity: 1; stroke: #E2E8F0; stroke-width: 1.5;
                                       border-radius: 20px; box-shadow: 0 10px 24px rgba(15, 23, 42, 0.08); }
group.arch::label, group.flow::label, group.states::label { color: var(--accent); }

node        { border-radius: 12px; }
node::title { color: var(--ink); }
node::body  { color: var(--mute); }
node.hero   { fill: #F5F3FF; stroke: var(--accent); stroke-width: 3; }

edge        { stroke: #64748B; }
edge.link   { stroke: var(--accent); stroke-width: 2.5; stroke-dasharray: 8 5; }
edge.link::label { color: var(--accent); }
Tips
- Pick the outer direction for the shape of the slide. Tall regions (top-down flowcharts) sit side by side
with
direction: "right"; wide ones (activities flowing right) stack withdirection: "down". - Link to real nodes, not pseudostates. An arrow into an initial node is rejected, so point at the first action or state instead.
- Give each region a class (
class_="flow") and style them as cards, so the reader sees where one diagram ends and the next begins. - Style cross-region arrows apart (
class_="link", dashed and in an accent colour). They read as "this triggers that", not as part of either flow.
For a real-world case, see Gateway API routing on EKS: an HTTPRoute's rules drawn as a flowchart inside the cluster.
More on each builder: Behavior diagrams.