
Diagrams as code, editable everywhere
Write a few lines of Python. Get SVG, PNG, PowerPoint with native shapes, and Figma nodes you can keep editing. spinagram does the layout.
pip install "spinagram[all]"from spinagram import Diagramd = Diagram("Q01", "Web app on AWS", subtitle="No coordinates, laid out automatically")users = d.box("Users", icon="aws:users")with d.group("us-east-1", style="aws-region", direction="right"): with d.group("VPC", style="aws-vpc", direction="right"): lb = d.box("Load balancer", icon="aws:alb") api = d.box("API", text="FastAPI on ECS", icon="terrastruct:python") with d.group(): # no style: a light "soft" zone db = d.box("Orders DB", text="PostgreSQL", icon="terrastruct:postgres") cache = d.box("Cache", text="Redis", icon="terrastruct:redis") s3 = d.box("Uploads", text="S3 bucket", icon="aws:s3")users.to(lb, "HTTPS") >> apiapi.to(db, "SQL")api >> [cache, s3]d.save("out/", formats=["svg", "png", "pptx"])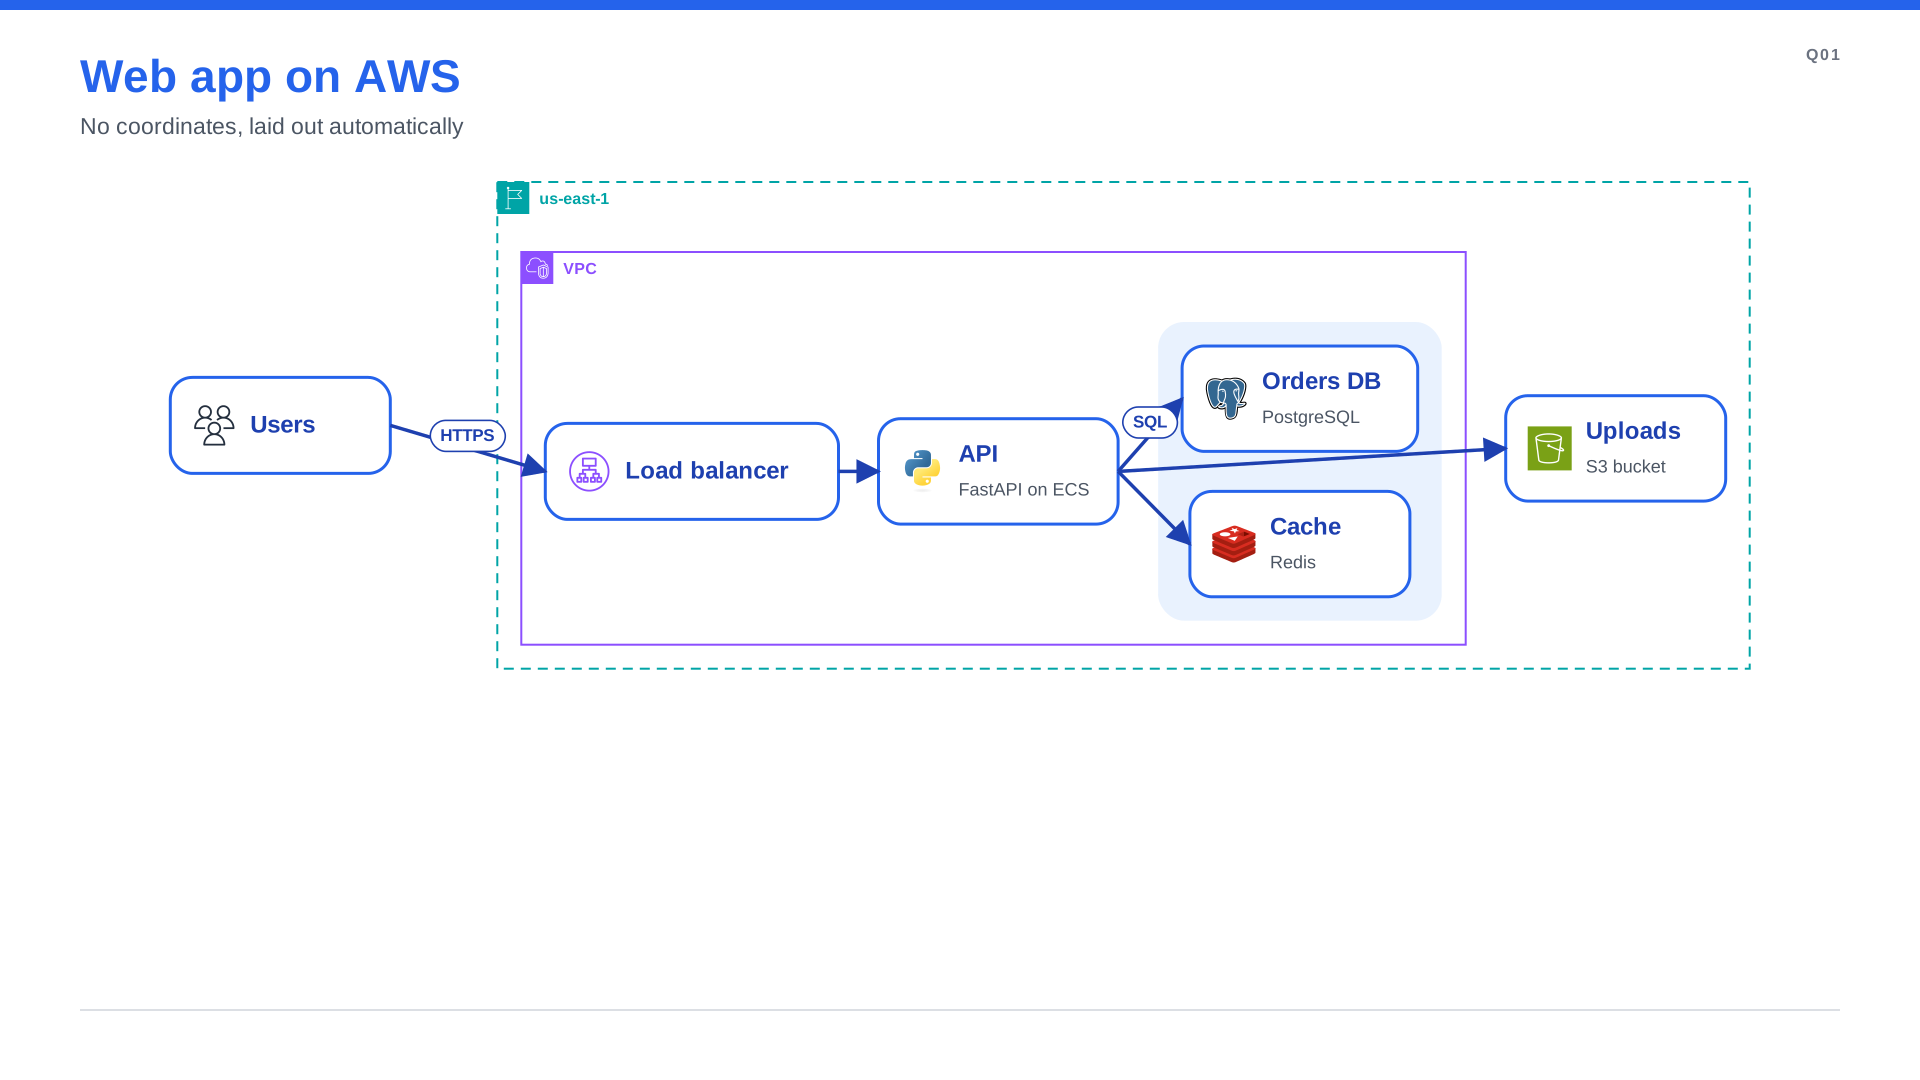
Editable everywhere
PowerPoint slides with native shapes and bound connectors, Figma and FigJam nodes, SVG and PNG.
Python first
users >> lb >> api. Groups are with-blocks, lists fan out, loops build the rest.
Automatic layout
No coordinates. Boxes fit their text, groups nest, four engines to choose from.
Thousands of icons
AWS, GCP, Azure, Kubernetes, OCI, OpenStack and Terrastruct, downloaded on first use.
Your brand
One theme directory sets colours, fonts, styles and chrome for every output.
Built for review
Overflow checks, a live preview, and numbers that carry their sources.