
Introduction
Describe your system in a few lines. Get a finished, editable diagram.
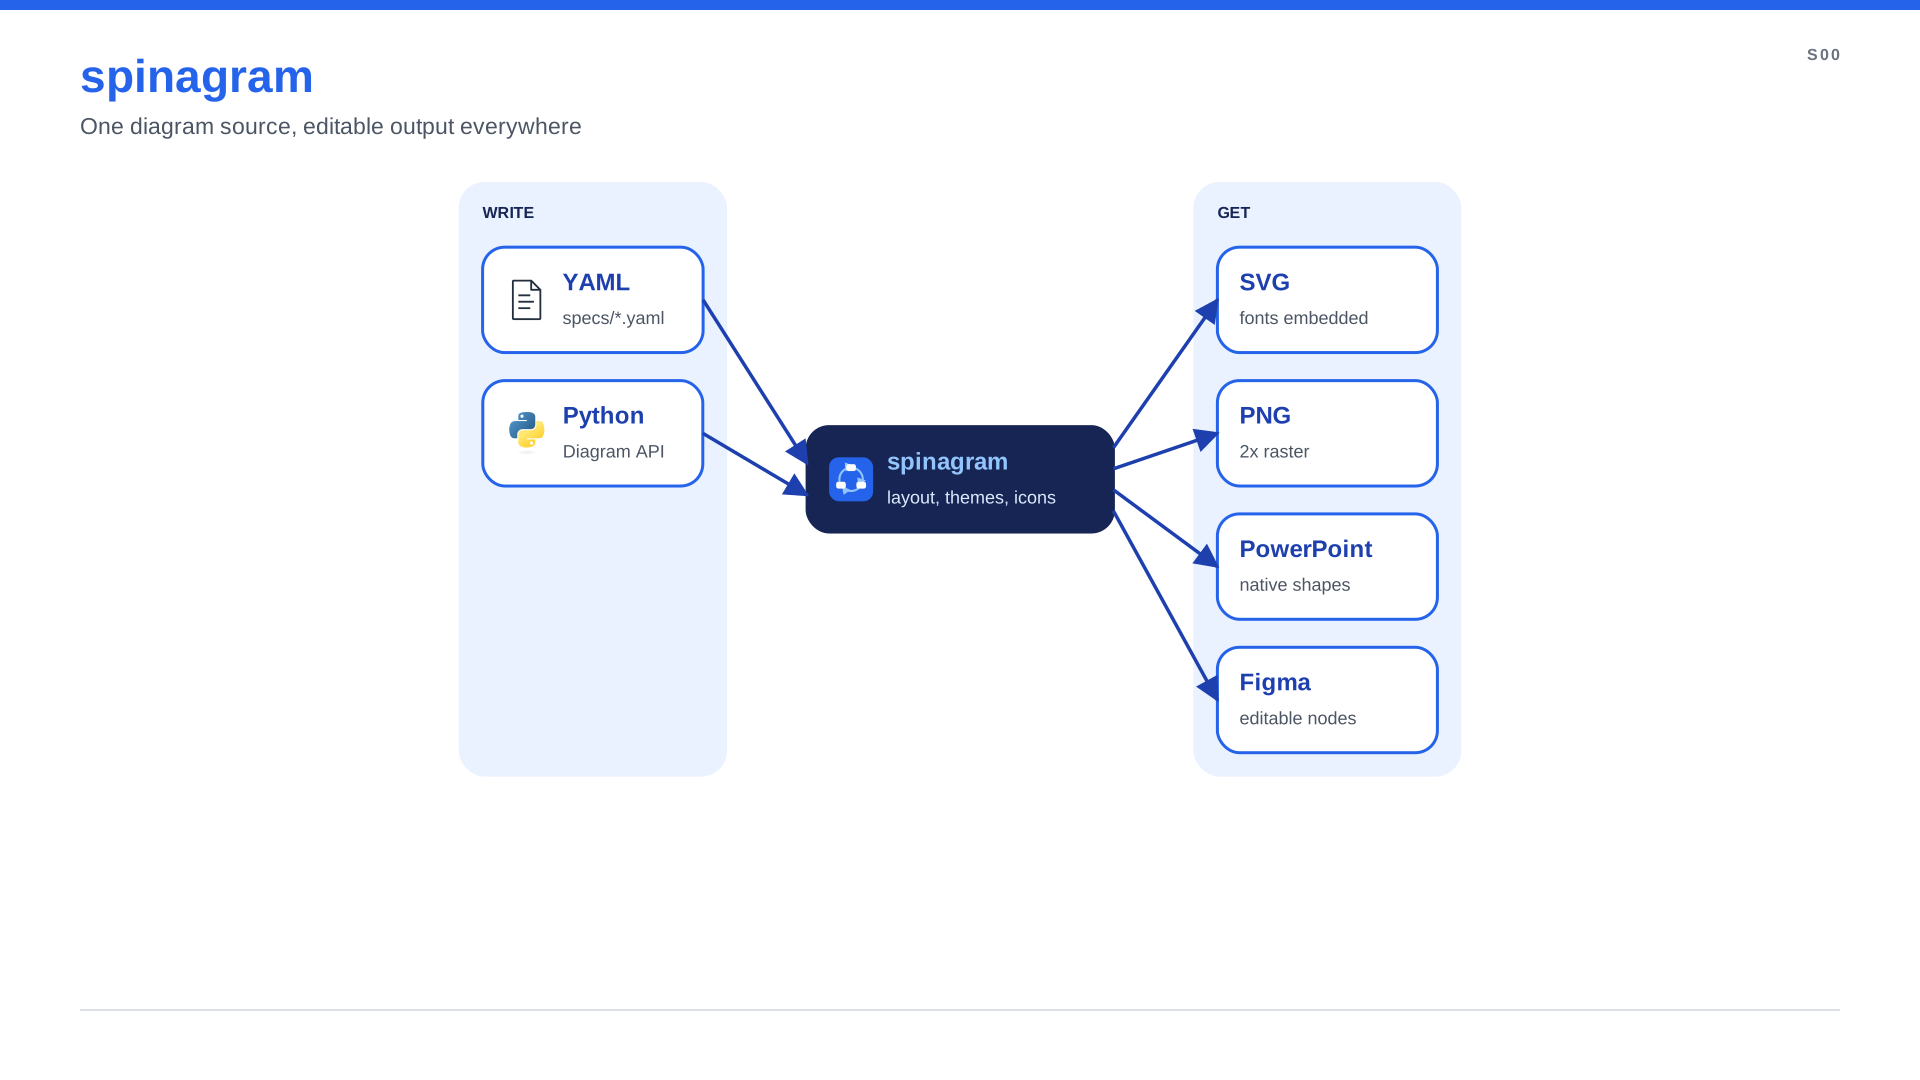
spinagram turns a short description of your system into a finished diagram: laid out, styled, annotated and ready for a slide deck. You say what is connected to what. spinagram picks the sizes and positions, draws the icons and routes the arrows, then hands you SVG, PNG, PowerPoint slides with native shapes, and Figma or FigJam nodes you can keep editing.
What you can make
Every picture on this page was rendered by spinagram from a file in
examples/. Click one to see how it is built.
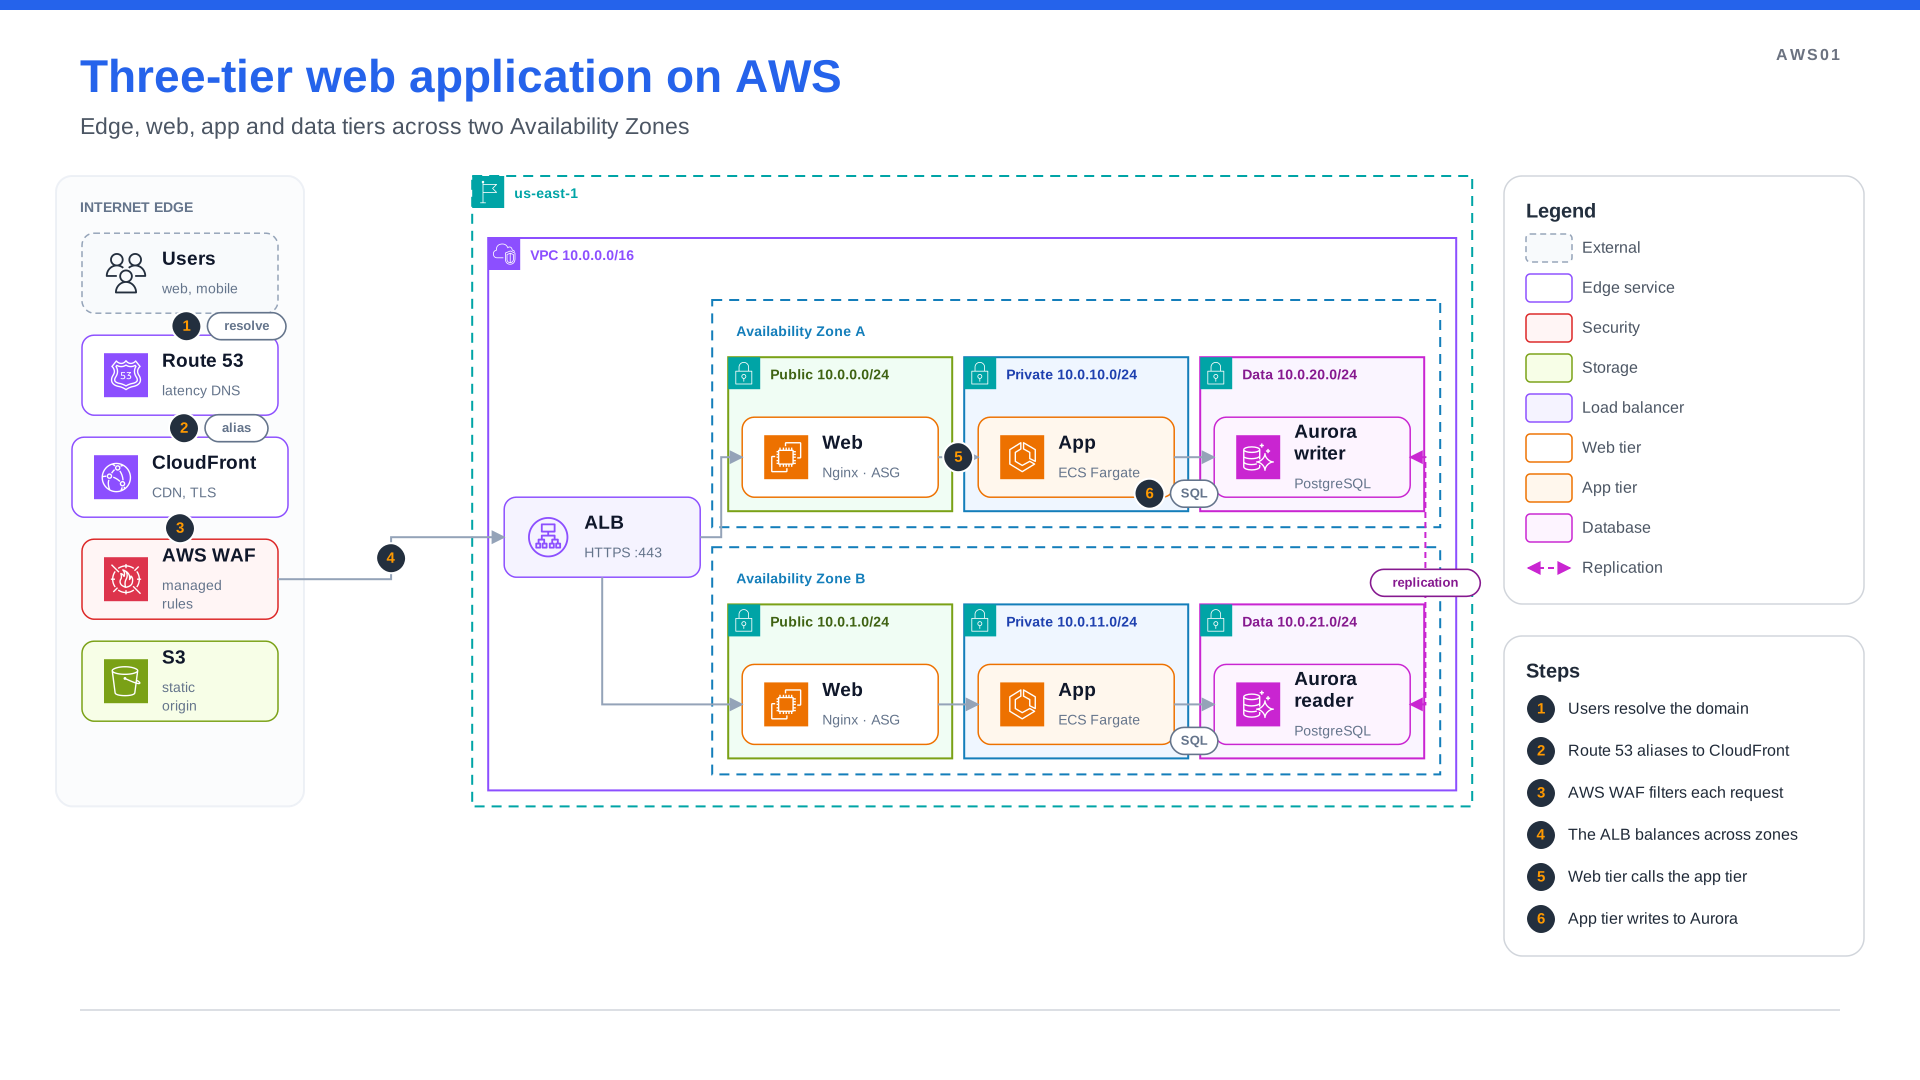
Cloud architecture
Regions, VPCs and zones nest themselves. Legends and numbered steps tell the story.
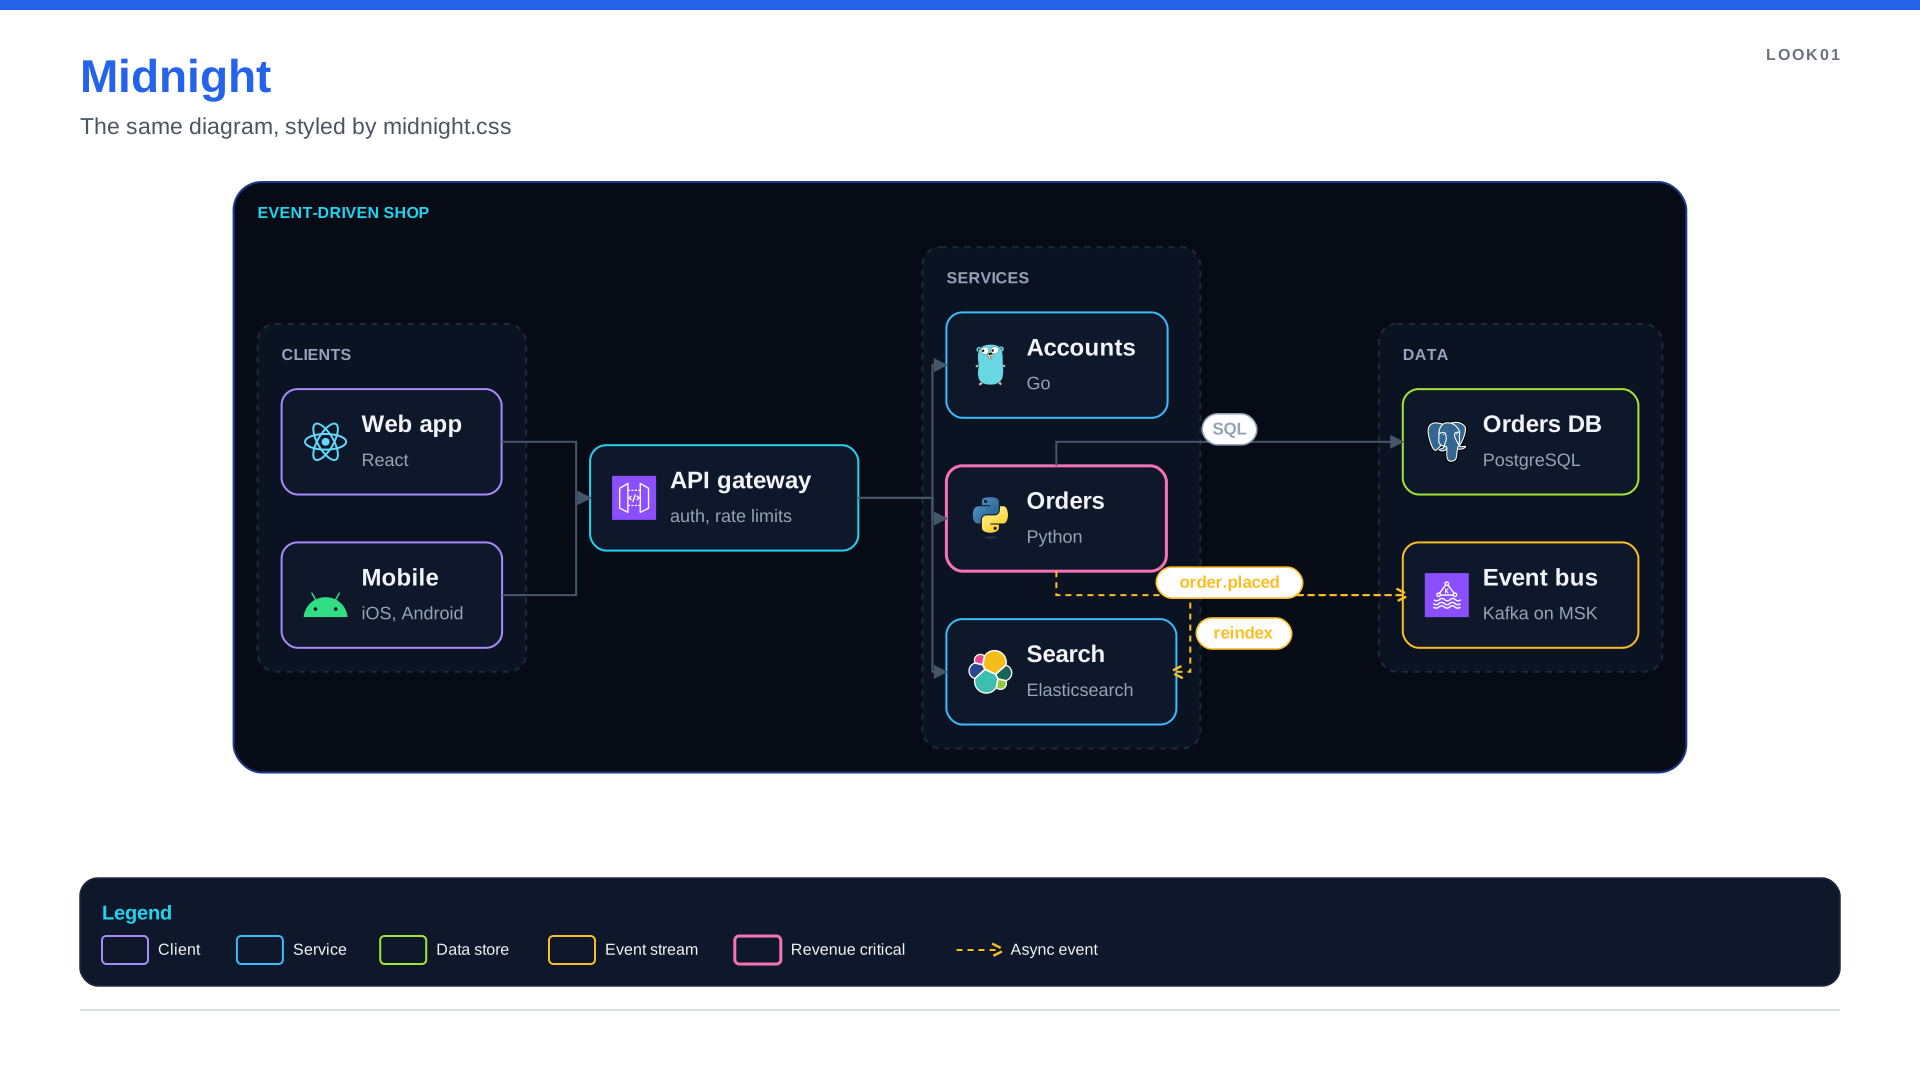
Stylish with CSS
One stylesheet turns the same diagram into a dark, neon, blueprint or print look.

Kubernetes on EKS
Cilium, Gateway API, Karpenter and Argo CD on a dark cluster canvas.
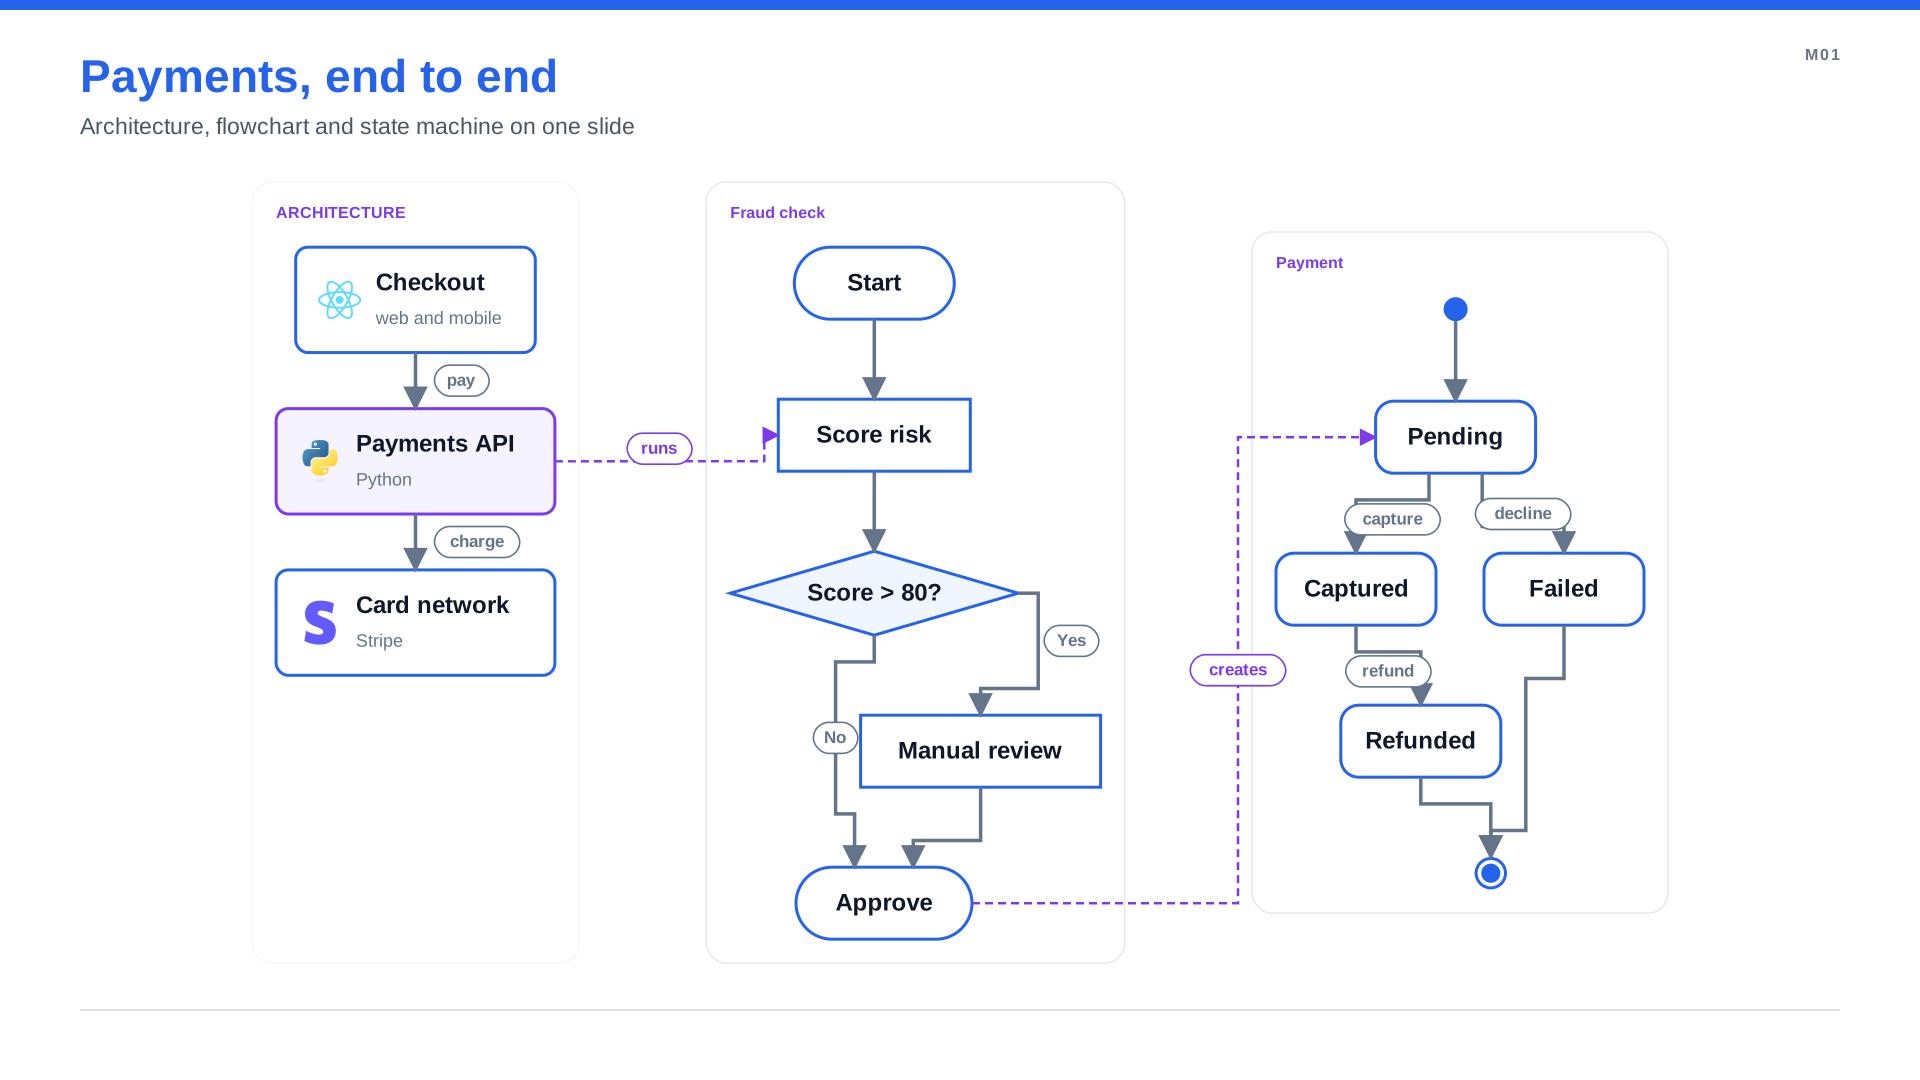
Several diagram types, one slide
Architecture, a flowchart and a state machine, connected by arrows.

Icons in one argument
icon="aws:eks": thousands of icons across thirteen packs, or your own file.
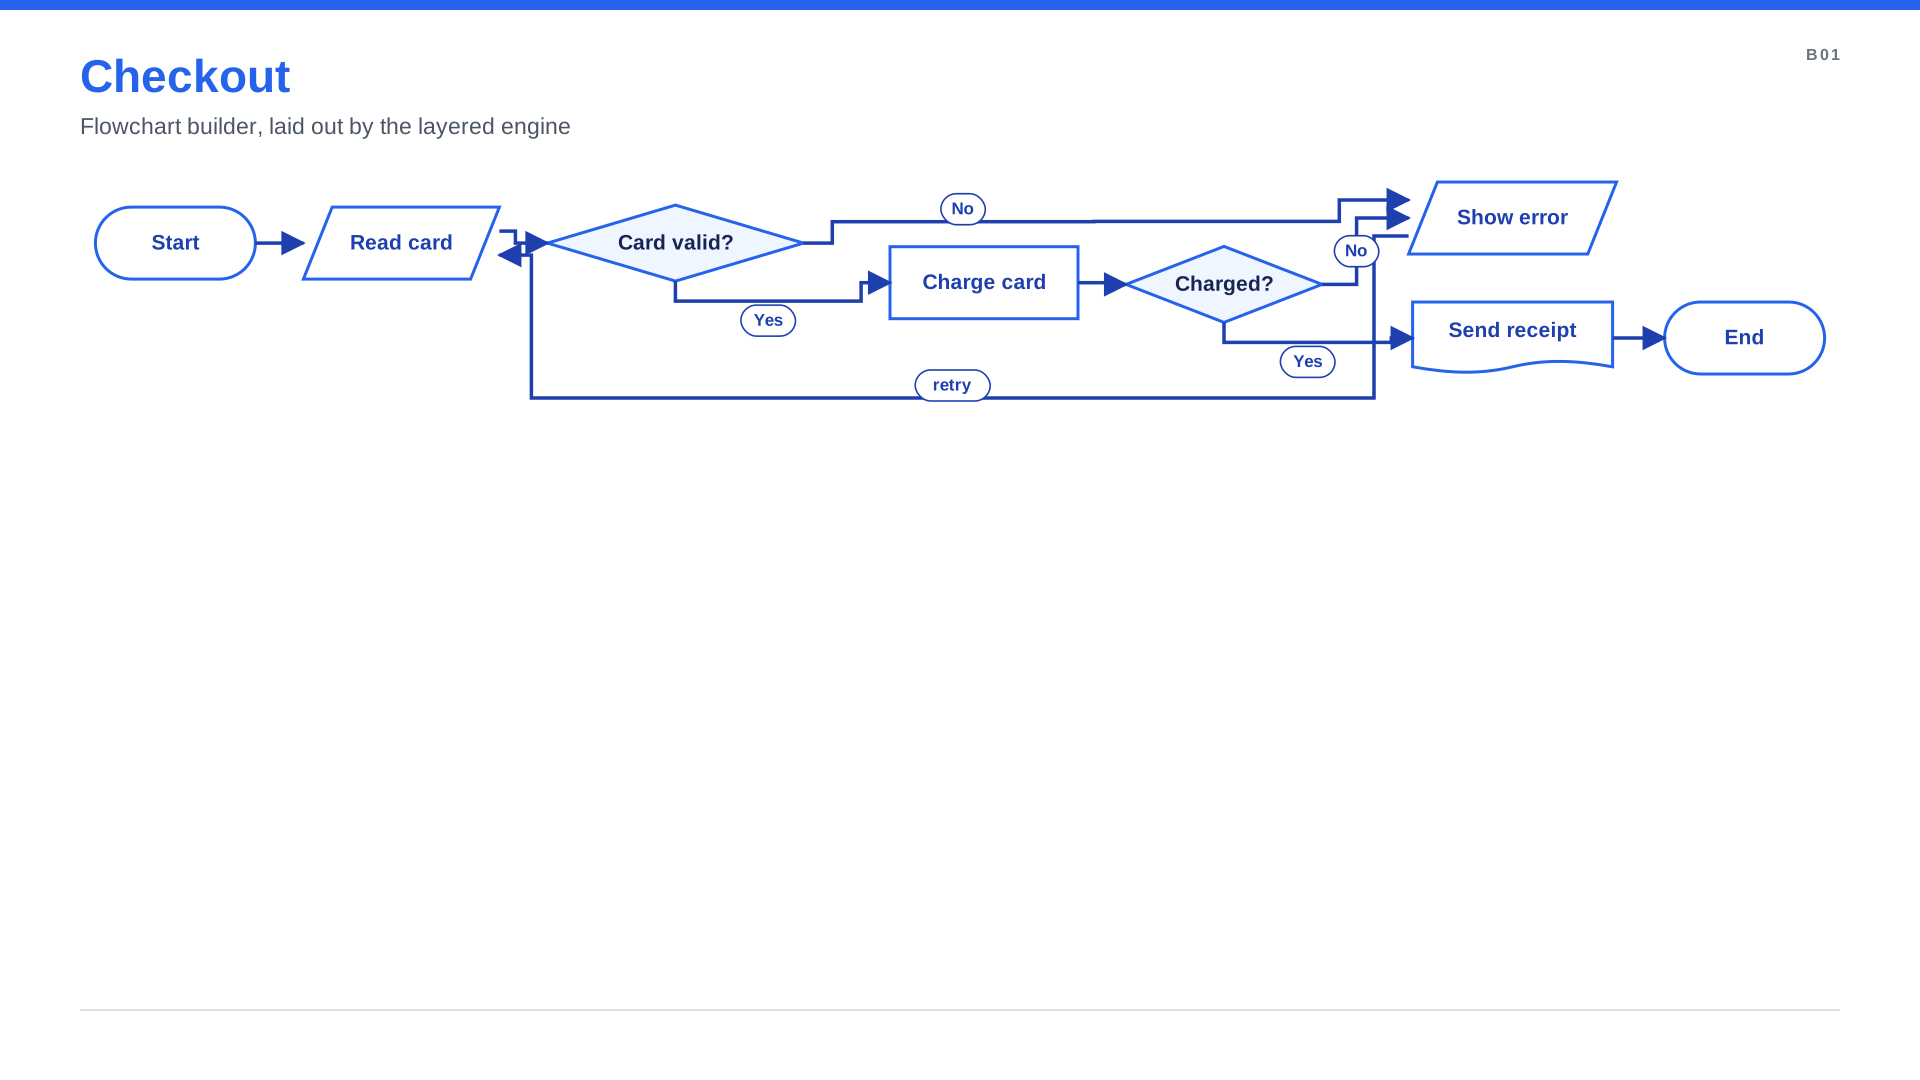
Flowcharts and decisions
decision.yes(...), decision.no(...): the layout ranks the flow for you.
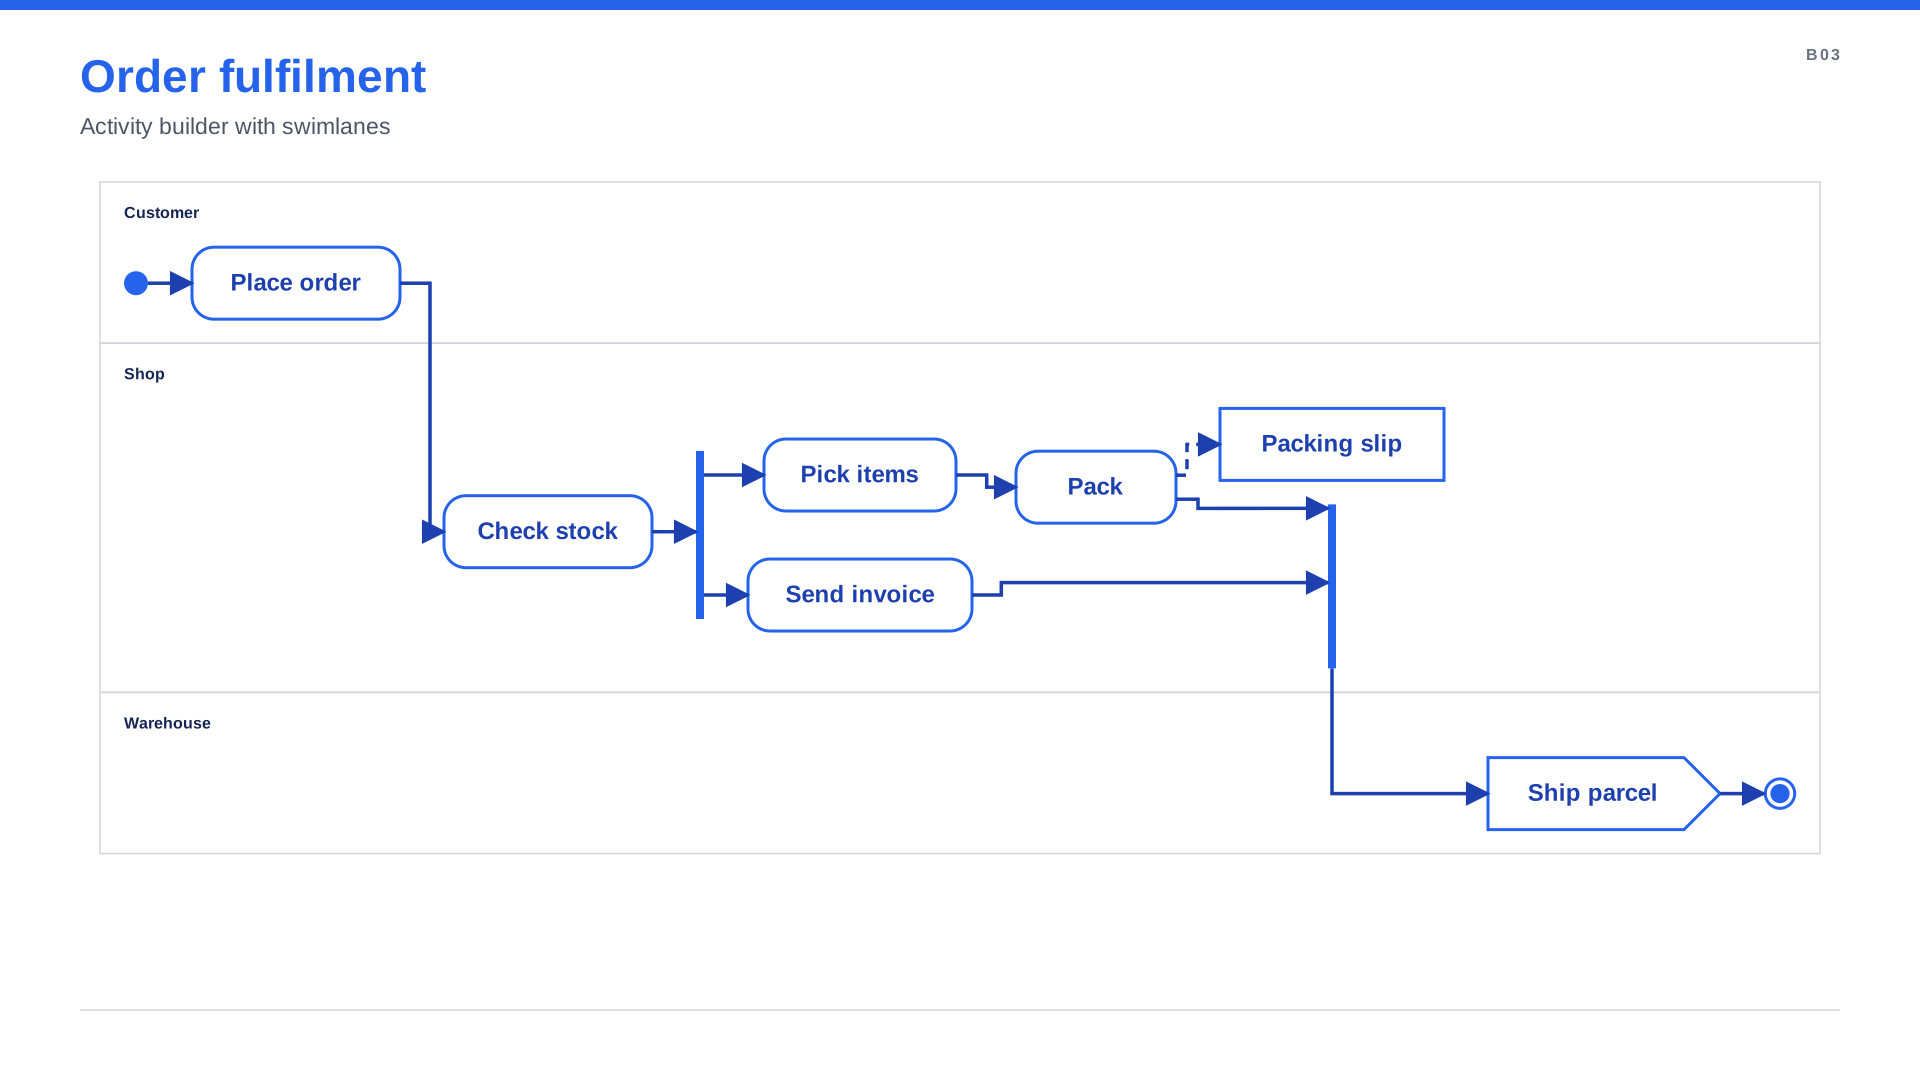
Processes with swimlanes
Who does what, with parallel branches drawn as fork and join bars.
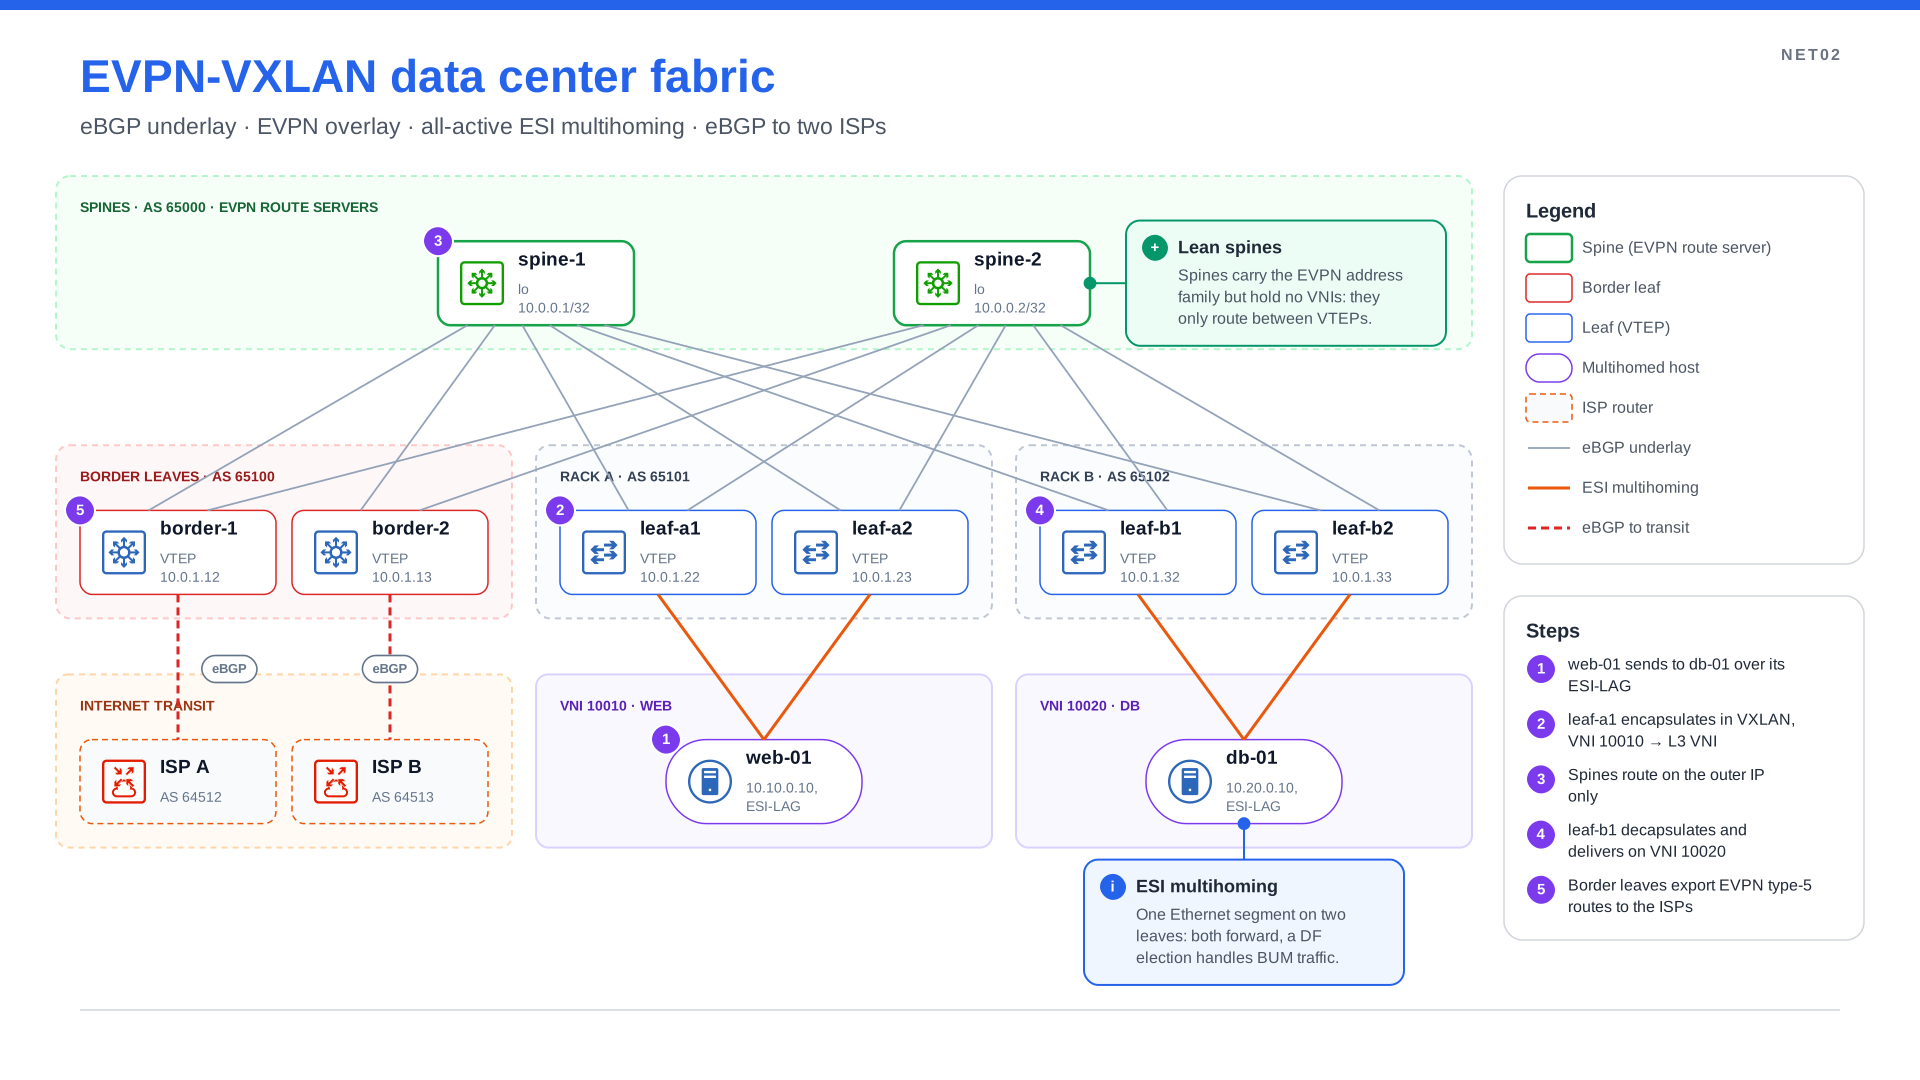
Network diagrams
Data center fabrics, campus networks and homelabs with dedicated icon packs.
Why people use it
- You never drag a box. Boxes grow to fit their text and icon, groups wrap their children, arrows avoid the boxes. Change one line and the whole picture re-flows.
- The output stays editable. PowerPoint gets real shapes with connectors bound to them: move a box and its arrows follow. Figma gets real frames. Nobody has to redraw a screenshot.
- Diagrams explain themselves. Numbered steps, callouts and an automatic legend live on the slide, so the diagram still makes sense when you are not in the room to present it.
- One look across the whole deck. A theme or a CSS stylesheet sets colours, fonts and line styles for every diagram at once.
- Reviewable like code. Diagrams are text files: diff them, review them in pull requests, and
let
spinagram checkcatch overflowing text before anyone sees it. - Your AI agent can draw them. spinagram ships skills that teach coding agents to write, style and check diagrams for you.
Pick your path
Tutorial: your first diagram
Seven short steps from an empty file to a styled, annotated PowerPoint slide.
What's new in 0.4
The layout engine fits text, lays out zone headers, places labels, routes edges and fixes what it can.
Examples
A gallery of working diagrams to copy: CSS looks, mixed diagram types, icons and more.
Let an AI agent draw it
Install the skills and ask for a diagram in plain words.